How can you be more transparent with your client’s data? One of the best ways is to deliver a client-facing dashboard. In our research, we have found two solutions – Klipfolio and Data studio. Each of them has different strengths and weaknesses. The following is a comparison between them.
How quickly can you deploy a dashboard?
When you get a request to build out a dashboard or if you want to show your client a dashboard, you may have to get it working fast. This is a key difference between the platforms.
Data studio is fast as long as your client is using all Google products that they use for reporting (Google Analytics/Google Adwords for example). If you have a platform that does not have a connection to data studio, you will have to find a workaround or keep that data out of the dashboard. Graphs and charts are easy in the WISIWIG (What I See Is What I Get) interface.
Klipfolio tends to take longer for an initial build out. Making graphs and charts that are complex can be very difficult as there are so many configuration possibilities in Klipfolio. Since Klipfolio is not just for charts and graphs (it can also do more complex operations like calculated columns) you need to “program” it in a way. You don’t get the pre-built graphs or charts.
User interactivity
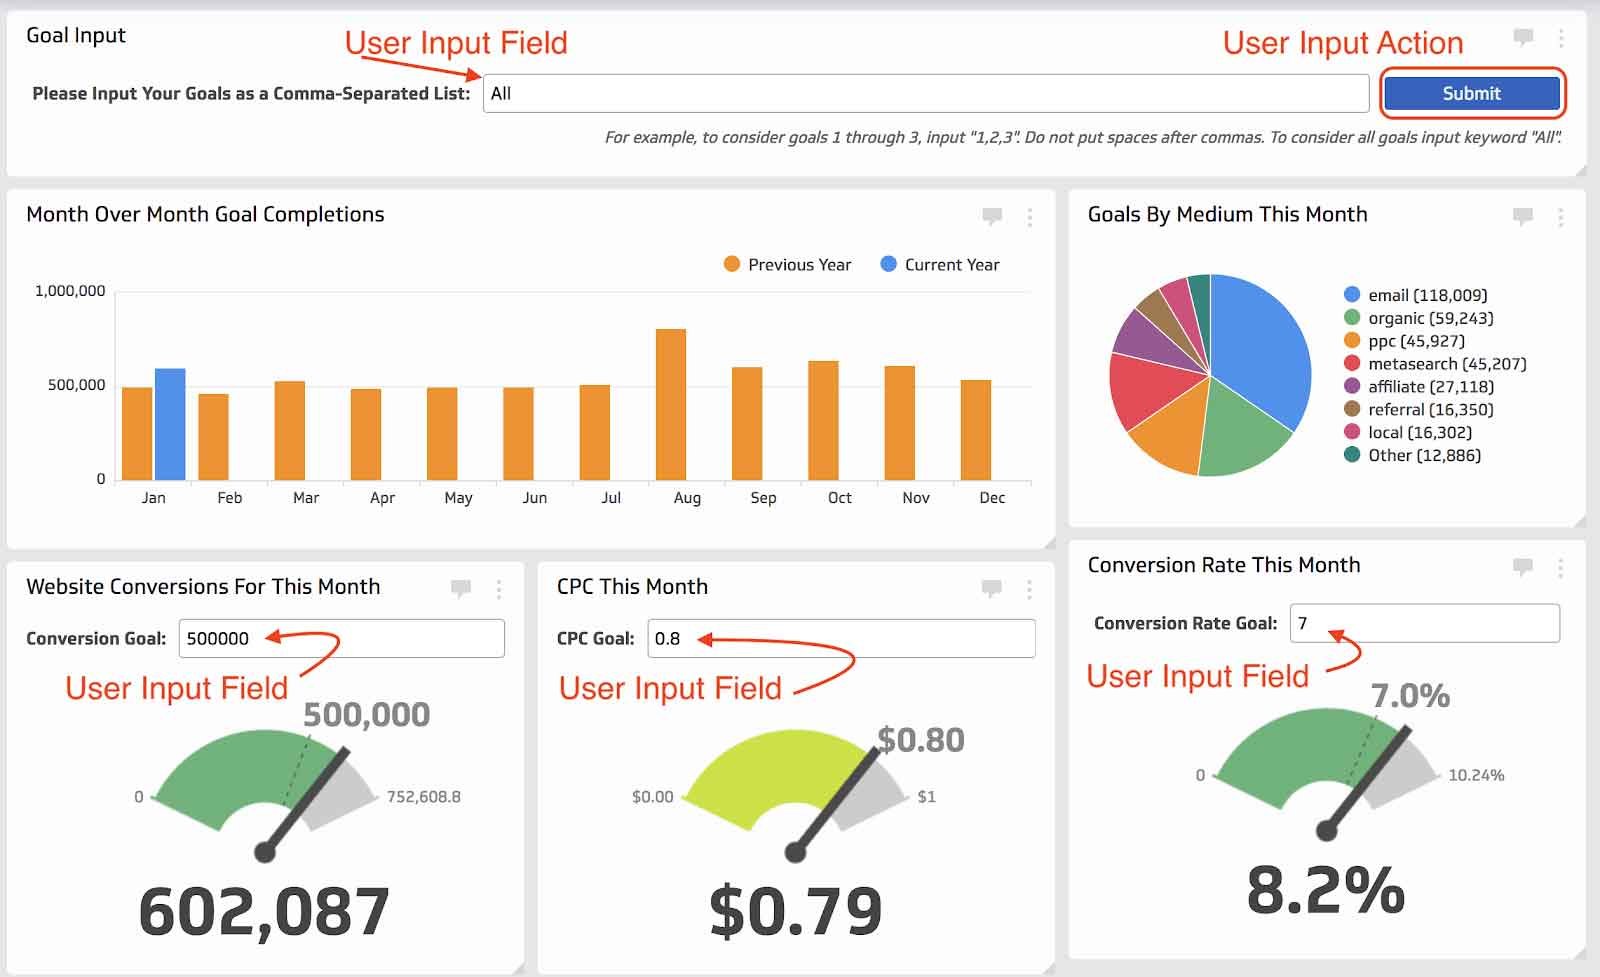
In addition to just showing your data, the dashboards can allow you to interact with it in different ways. For example, if you had a user input field that allows you to place a number (such as a goal) to match your data against, the dashboard can show that number there plus show how you are trending toward that number.
In data studio, you don’t have too many options. You can select date ranges or hover over pie charts to see the exact numbers. There are no user input areas besides that.
Klipfolio on the other hand has user input fields and buttons that will allow the user to input values that will be taken into account. For the below example, we can see that you can select individual goal types with an input field (EX 1,3,7 for multiple goals) and the graphs below can change once the submit button has been pressed.
Sharing of dashboards
Both Data Studio and Klipfolio have the ability to share their dashboards with other users. This ability allows a builder to construct a dashboard and modify its code while an end user can only view and interact with the dashboard using the supplied buttons. This prevents users from accidentally deleting or modifying items on a dashboard that will change the experience for other users. Both platforms have different abilities when it comes to sharing.
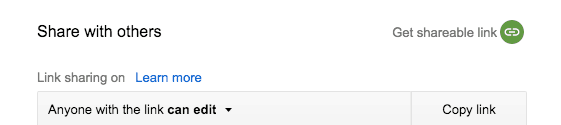
Data Studio allows for links to the dashboards to be shared – much like how you can do with a Google Sheets or document, you can share via a link. The link can be configured to edit or view only access.
In addition to a link being shared, you are also able to embed a dashboard into a website via an iFrame; this way, your team members or clients can log in to see their performance.
Klipfolio, on the other hand, has a few different and yet similar options. You are able to share a link to other users, but you are also able to password protect it so if the link gets into the wrong hands, they can’t see the dashboard (and your data) without the password. In addition, you can have a PDF sent out at a specific time every day, week, or month with the PDF version of the dashboard to specific users. You are also able to embed a dashboard VIA iFrame as well.
Downloading of data
Next up – what if you need to get data out of that dashboard? Both platforms really would rather that you keep your data in the dashboard (and that’s my personal opinion as well), but if you need the data out of there, both platforms offer different options.
Data Studio allows for data to be downloaded from a specific graph or chart. The data would come out as a CSV file or go to an associated google drive. You would not be able to download the full dashboard.
Connections
So where can these dashboard platforms get their data from? Klipfolio can get data from nearly any platform that has an API. For example, Pardot, Google Drive, Google Analytics, BING Ads, Salesforce, LinkDex to name a few.
Data Studio at this moment can only connect to other Google sources like Google Adwords, Big Query, and Google Analytics. Although Google does say that they are working to build out more connectors, right now you may buy 3rd party connectors from the app store to integrate outside of Google products – like MailChimp for example.
Multiple data source compilation
What if you need to marry or perform calculations from two different data platforms, Klipfolio is your place to be. This is where the platform shines. Say you have data in Google AdWords and you want to marry it to Bing Ads (EX: you want the total clicks across ALL of your advertising campaigns). Klipfolio can accomplish this with its ability to add, data together. You can also perform other functions as well such as subtracting, dividing, multiplying, and even some spreadsheet functions like VLOOKUPS.
At the time of this writing, Data Studio is not able to combine any data from other platforms as described above.
Choose wisely per project
Both of these platforms offer beautiful dashboards. The important part is to scope out your project fully to understand which platform to move forward with. If you need something quickly and lite, Data Studio is the way to go. Need some heavy duty number crunching and combining data sources – Klipfolio is the way to go.
Want to know more about analytics for your business? Start a conversation!

SUBSCRIBE TO OUR BLOG
Stay up to date with the latest industry best practices in digital marketing!


.png?width=339&height=179&name=Webinar%20Banner%20(1).png)


.png?width=339&height=179&name=July%20Webinar%20(Newsletter).png)

.png?width=339&height=179&name=Webinar%20Banner-April-02%20(1).png)
%20(4).png?width=339&height=179&name=Webinar%20Banner-May-02%20(1)%20(4).png)


.png?width=339&height=179&name=March%202023%20Webinar%20Ad%20(autoresponder).png)


.svg)
.svg)
.svg)

%20(1).svg)
.svg)
.svg)

.svg)