

When it comes to paid search performance, there is always more you can do to move the needle. Whether it’s implementing new features, optimizing off of a fresh week of data, or testing new ad copy, the sky’s the limit for new SEM projects. With so many options, it’s easy to get mired in the new and flashy. That’s why we’re shining a light on the overlooked corners of paid search—the unglamorous but essential basics that provide the foundation for paid search success.
In a series of articles, we’re calling Paid Search Pitfalls and Solutions, we’re diving into the top mistakes we find when inheriting accounts from competitors. Everyone has their own opinion on how to run paid search accounts and we respect that what works for one advertiser might not work for everyone else. So rather than offering up what we believe to be best practices, we feel it’s more valuable to point out common mistakes that should be addressed before moving onto the next big thing. More importantly, we’re offering solutions along the way that you can start applying for free!
To kick off our series, we’re starting with the mistake that’s so common it inspired us to write these posts in the first place. I’m talking about weighted averages, especially as it relates to reporting on average position and other similar paid search metrics. Whether you’re just starting out in paid search or you’re a seasoned professional, understanding how to report using weighted averages means the difference between accurate and misleading information. Even if you don’t directly work in the SEM space, knowing what to look for in the reports you receive will protect you from making business decisions based on inaccurate insights.
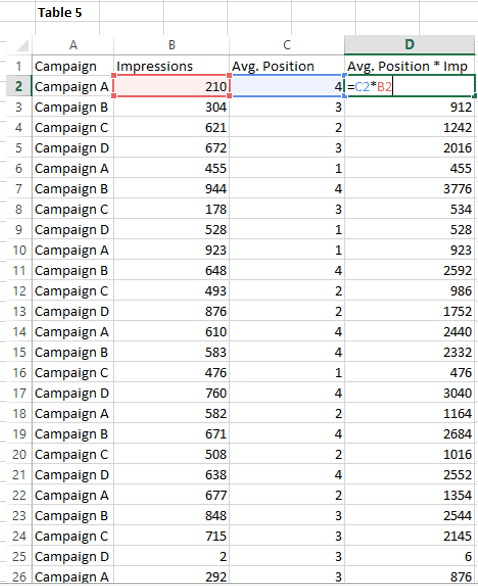
So let’s say you’re putting together a report showing performance data by campaign. Your data will probably end up looking something like this:
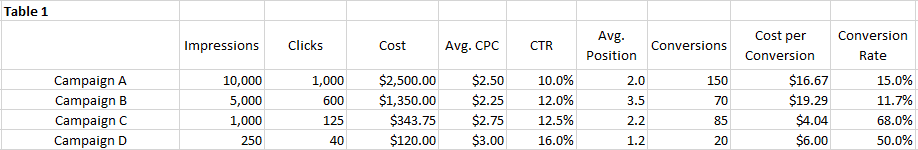
Now when you go to total the various metrics, you will want to sum each column with hard numbers such as Impressions, Clicks, and Spend, but apply a formula for rates such as CTR, Avg. CPC, and Conversion Rate. This should be fairly intuitive since each campaign has a different amount of clicks, so taking an average of the CTR from all campaigns would result in a misleading number. For example, “Campaign A” makes up 57% of all clicks, so the CTR from Campaign A needs to be weighed much more heavily than the CTR from lower-volume campaigns when assessing the CTR of the account as a whole. When we use a formula that divides total clicks by total impressions, we end up with an average CTR that factors in the relative weights of each campaign.
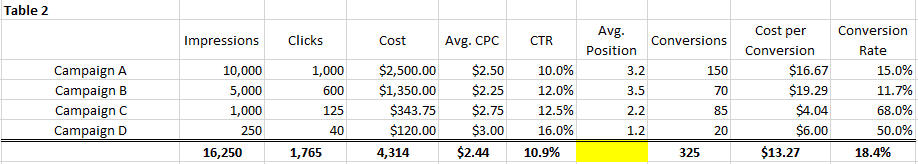
If you’re thinking that this information is very obvious, that’s great! That means you’re on the right track to understanding what might be a little less intuitive: average position for all campaigns. I’ve come across SEM reports that simply take the average of the average positions from each campaign and use that value as the average for the total.
At first glance, it might not be obvious that this number is wrong, but based on what we discussed above, it should be clear that we need to place more emphasis on the average position from campaigns with many clicks or impressions than we do for campaigns with very few clicks or impressions. Without an easy formula like CTR = Clicks / Impressions, though, how can we arrive at the true average position for the total row of our table?
There are two different solutions we’re going to walk through: one for tables like the one we’ve been working with and one for pivot tables used on large data sets. First, let’s work through the simpler of the two solutions.
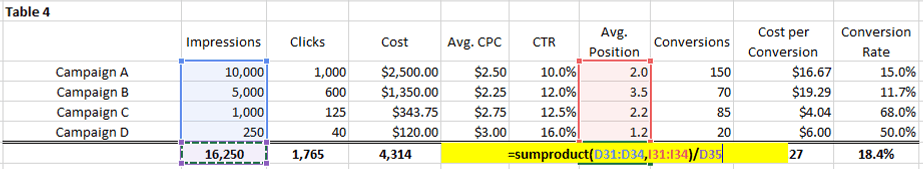
The key is to assign a weight to each average position by multiplying each campaign’s average position by the same campaign’s total impressions to get what we’ll call “Avg. Position * Imp.”. If we add this value for each campaign and then divide by total impressions, we will get the weighted-average position for all campaigns. This could be daunting with large data sets, so luckily there is a little-known excel equation called =SUMPRODUCT that does the heavy lifting. Just type =SUMPRODUCT and enter the 2 columns (separated by a comma) that you want multiplied together. Finish off the equation by dividing by total impressions and you’ll have your total avg. position for all of your campaigns!
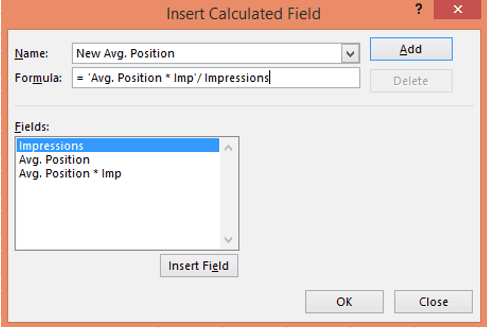
Now, let’s work through a similar solution, but for pivot tables and large sets of data. First, we need to create a column called “Avg. Position * Imp” to the right of our data set with the formula (you guessed it): Avg. Position * Impressions.
Next, create a pivot table selecting all of your data, including the new column you created. Finally, create a calculated field with the formula “Avg. Position * Imp” / Impressions and save your new column. Now, you can pull in the new column you created and use it for any filters, rows, or segments you choose to pivot your data by.
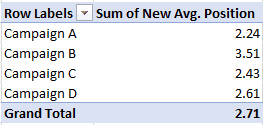
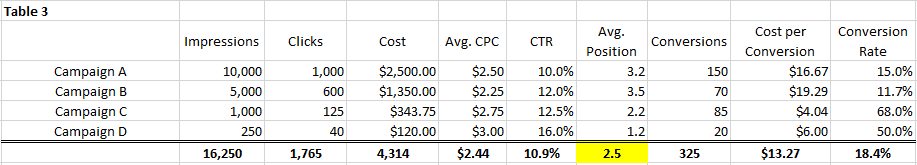
So why does this approach to weighted averages matter? In the first example, when we just took the average of all average positions, we ended up with an average position of 2.5. When we factored in the weight of each campaign by impressions, we ended up with an average position of 3.2. The conclusions and next steps you would determine based on an average position of 3.2 and 2.5 are vastly different. Making strong business decisions starts with accurate data, so avoiding this common reporting pitfall will bring you one step closer to reaching your or your clients’ business objectives.
We will be sharing more pitfalls and solutions each week, so be sure to check out our blog, Facebook, and Linkedin pages to stay tuned! Like the way we think? Contact us to work with us or visit our Careers Page to browse open positions.

SUBSCRIBE TO OUR BLOG
Stay up to date with the latest industry best practices in digital marketing!


.png?width=339&height=179&name=Webinar%20Banner%20(1).png)


.png?width=339&height=179&name=July%20Webinar%20(Newsletter).png)

.png?width=339&height=179&name=Webinar%20Banner-April-02%20(1).png)
%20(4).png?width=339&height=179&name=Webinar%20Banner-May-02%20(1)%20(4).png)


.png?width=339&height=179&name=March%202023%20Webinar%20Ad%20(autoresponder).png)


.svg)
.svg)
.svg)

%20(1).svg)
.svg)
.svg)

.svg)