Google Analytics 4 is a powerful new tool that can help you track your website traffic and performance. Without getting into the contention between UA users and GA4 adopters (you know who you are), we can all agree that GA4 is a little confusing to use at first. One of the more confusing aspects of Google Analytics 4 is the concept of secondary dimensions. What are they? How do you use them? And what are some of the best ways to take advantage of them? In this comprehensive guide, we will answer all of those questions and more! So read on to learn everything you need to know about secondary dimensions in Google Analytics 4!
What Are Secondary Dimensions?
Secondary dimensions in GA4 (or UA for that matter) are branches of the primary dimension that divide every row of primary dimension data to provide more details. More simply put, they are an easy way to break down your data into more granular chunks. This allows you to draw conclusions and make connections that you otherwise would not be able to.
Let’s look at some examples so we can see how this data is presented. For instance, if you’re in the traffic acquisition report in GA4, you can see below that it’s initially broken down by Source of traffic – Organic, Direct, Paid, etc.
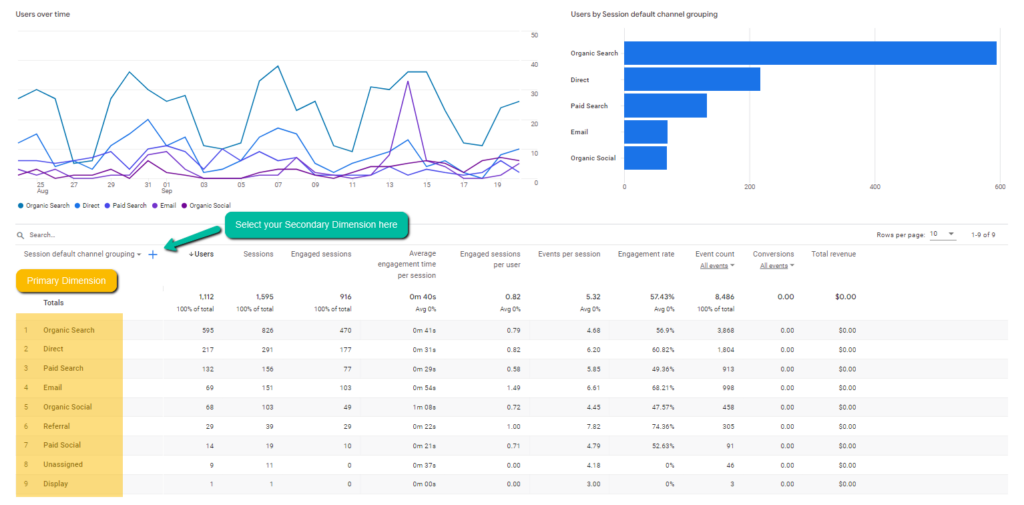
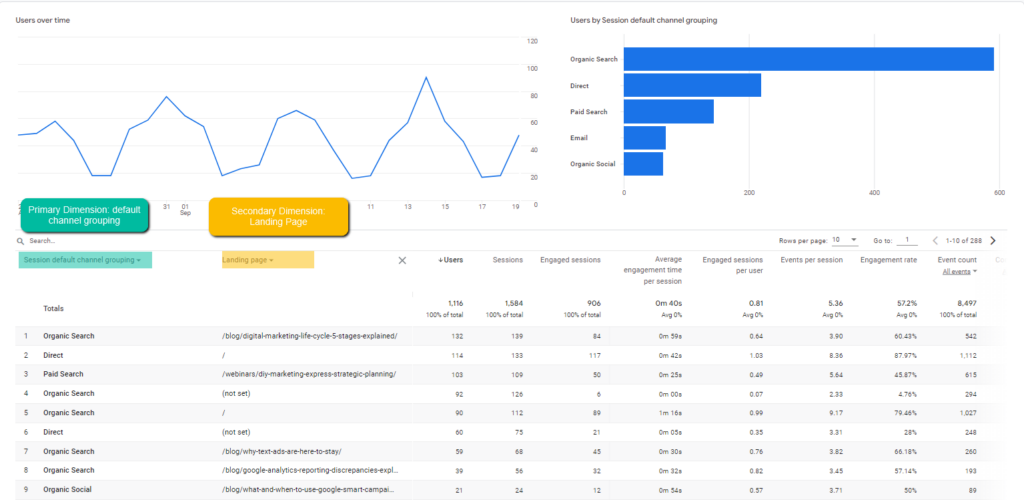
In order to add a secondary dimension in GA4, you would click the blue plus sign next to “Session default channel grouping” and follow the drop down menu to add your secondary dimension. In the instance below, we added a secondary dimension of Landing Page onto this report. In order to select Landing Page as your secondary dimension you would follow this path: + > Page/ screen > Landing Page. You can see it’s now sorted by the top landing page per source.
This is just one way to use secondary dimensions, but there are many different ways we can use this to better explore the data within GA4. Secondary dimensions help attach meaning to a mountain of data that Google Analytics collects for you.
What Secondary Dimensions are Available in GA4?
Here’s the full list of categories and secondary dimensions within each category in Google Analytics 4 (this list does not include custom dimensions, which is a whole different discussion):
Demographics:
- Age
- Gender
Geography:
- City
- Country
- Region
Page / Screen
- Hostname
- Landing Page
- Page path and screen class
Platform / Device
- App Version
- Browser
- Device Category
- Language
- Device Brand
- Device
- Device Model
- Operating System
- OS with Version
- Screen Resolution
- Stream ID
- Language Code
Traffic Source:
- First user campaign
- First user default channel grouping
- First user Google Ads ad group ID
- First user Google Ads ad group name
- First user Google Ads ad network type
- First user manual ad content
- First user manual term
- First user medium
- First user source
- First user source / medium
- First user source platform
- Session campaign
- Session Google Ads ad group ID
- Session Google Ads ad group name
- Session Google Ads ad network type
- Session manual ad content
- Session manual term
- Session medium
- Session source
- Session source / medium
- Session source platform
User Lifetime:
- First session date
- First visit date
User:
- Audience name
- Signed in with user ID
What Reports in GA4 Can You Use Secondary Dimensions On?
Now you may be asking yourself – what other reports can you use secondary dimensions on besides traffic acquisition? Well, thankfully you can use them on any of the following (not including the explore section of GA4 which also includes them):
- Traffic acquisition
- User acquisition
- Events
- Conversions
- Pages and Screens
- Ecommerce Purchases
- In-app Purchases
- Publisher Ads
- Demographic Details
- Tech Details
As you can see with these primary dimensions and all of the previous secondary dimensions listed, it is possible to make many connections and paint the data in a massive variety of ways. So let’s get into it!
How Can You Use Secondary Dimensions?
Secondary dimensions can provide a richer understanding of your data by giving you more insight into how people interact with the site. For example, if there is an audience that exclusively visits on mobile devices but refuses to complete any conversions then this might be worthwhile information for marketing campaigns since they are less likely to convert than others with similar browsing habits!
Some interesting ways to use secondary dimensions include:
- Finding out what landing pages appeal to which demographics
- Seeing if there is a noticeable difference in engagement rate based on landing page
- Finding a correlation (if any) between engagement and device or device type
- Drawing a link between landing page, certain events, demographics, or geolocation and conversions
But that’s just a few different ways to organize your data. We recommend going in and experimenting with different reports and different secondary dimensions depending on what your business goals are. Also, explore the Explore area! It’s a little daunting at first to build your own reports, but rest assured, it will make you better at finding trends and interactions with your website over time. If you have any questions in the meantime, or want to pull an expert to help you better understand your website’s analytics, reach out to us at Be Found Online.

SUBSCRIBE TO OUR BLOG
Stay up to date with the latest industry best practices in digital marketing!


.png?width=339&height=179&name=Webinar%20Banner%20(1).png)


.png?width=339&height=179&name=July%20Webinar%20(Newsletter).png)

.png?width=339&height=179&name=Webinar%20Banner-April-02%20(1).png)
%20(4).png?width=339&height=179&name=Webinar%20Banner-May-02%20(1)%20(4).png)


.png?width=339&height=179&name=March%202023%20Webinar%20Ad%20(autoresponder).png)


.svg)
.svg)
.svg)

%20(1).svg)
.svg)
.svg)

.svg)